

Fixed-fee licensing deals with slot or live casino studios can look like a bargain compared with headline 15-20 % revenue-share agreements—until you discover they are quietly draining margin. The only way to know whether a flat monthly invoice beats a %-of-GGR contract is to run a disciplined break-even calculation before you sign. This guide shows casino operators and product managers exactly how to do that, complete with formulas, worked examples, and a free sensitivity table you can copy straight into Excel or Google Sheets.
1. Why Fixed-Fee Game Deals Exist (and When They Make Sense)
Game providers typically offer three commercial models:
- Pure revenue share (e.g., 18 % of Gross Gaming Revenue). Zero upfront cost; the studio earns only when you earn.
- Fixed monthly licence (e.g., €18,000 per month, unlimited GGR). Good for high-volume operators who want cost certainty.
- Hybrid (discounted rev-share until a revenue cap is hit, then a flat fee). A hedged option for growing brands.
Fixed fees become attractive once your projected Net Gaming Revenue (NGR) exceeds the threshold where percentage fees would cost more than the flat price. That threshold is your break-even point.
2. Numbers You Need Before You Start
Break-even math is simple if—and only if—you feed it realistic data. Pull the following six inputs for each studio you are evaluating:
- Monthly licence fee ($ or €)
- Projected monthly GGR from that studio’s titles
- Any volumetric rev-share charged in addition to the licence (sometimes 1-2 % tech fee)
- Average game RTP (affects GGR resilience to variance)
- Promo cost on those titles (free spins, tournaments, etc.)
- Aggregator or platform pass-through fees (if the deal is not direct)
Spinlab clients can surface #2, #4, and #5 in seconds via the Real-Time Analytics dashboard; other operators will need to mine their data warehouse.
Typical Benchmarks (July 2025)
| Metric | Slots | Live Casino |
|---|---|---|
| Average monthly GGR per 1,000 Actives | €13,500 | €29,800 |
| Average promo cost as % of GGR | 4.2 % | 2.7 % |
| Common fixed fee (tier-1 studio) | €15k–€25k | €20k–€35k |
| Hidden tech surcharge | 0–2 % of GGR | 0–1 % |
Use your own figures wherever possible—the variance can be huge across brands and markets.
3. The Core Formula
Break-even occurs when the effective cost per € of GGR is identical in both models.
Let:
- F = Fixed monthly fee
- R = Revenue-share % (as decimal)
- S = Surcharges % (decimal)
- G = Projected monthly GGR
Break-even when:
F = (R + S) × G
Solve for G:
G_break-even = F ÷ (R + S)
If your projected GGR is above G_break-even, pick the fixed fee; if below, stick with rev-share.
4. Worked Example
You are negotiating with Pragmagic Studios for their new crash game bundle.
- Licence fee F = €22,000 / month
- Standard rev-share R = 18 % (0.18)
- Platform tech fee S = 1 % (0.01)
G_break-even = 22,000 ÷ (0.18 + 0.01) = 22,000 ÷ 0.19 ≈ €115,789
If you expect to generate over €116k GGR per month from Pragmagic titles, a flat €22k licence is cheaper.
Converting GGR to Player Volume
Sometimes revenue forecasts are difficult but you do know active-player or spin-volume projections. Rearrange:
Required Actives = G_break-even ÷ GGR_per_Player
Using the slot benchmark above (GGR_per_1k = €13,500):
115,789 ÷ 13,500 ≈ 8.6 → Need ~8,600 Pragmagic actives per month.
5. Sensitivity Analysis: Build a One-Click Table
Break-even is a moving target—marketing pushes, seasonality, and market openings can swing volume 30-50 % in a single quarter. A sensitivity grid lets you see where risk lives.
| Monthly GGR (€) | Rev-Share Cost at 19 % | Fixed Fee €22k | Delta (€) |
|---|---|---|---|
| 80,000 | 15,200 | 22,000 | –6,800 |
| 100,000 | 19,000 | 22,000 | –3,000 |
| 120,000 | 22,800 | 22,000 | +800 |
| 150,000 | 28,500 | 22,000 | +6,500 |
Positive delta means fixed fee wins. Highlight amber zones (<€5k variance). Update this sheet weekly using Spinlab’s data export to stay ahead of variance.
6. Hidden Costs That Blow Up Break-Even Models
- Content uplift clauses: premium titles released mid-contract may trigger a new fee.
- Jurisdictional add-ons: Spain, Ontario, and certain US states often incur +3–5 %.
- Game certification fees: some studios charge a per-jurisdiction testing pass-through.
- Mandatory promo fund: a fixed contribution to network jackpots counts as real money.
- RTP downgrades: running a 96 % math model where competitors offer 97 % can crimp GGR.
Always request a line-item pricing schedule before signing—then plug each scenario into your sensitivity sheet.
7. Live Monitoring: Knowing When to Flip Back
A deal you signed in Q1 may no longer be optimal in Q4. Auto-generated alerts in Spinlab’s Real-Time Analytics can warn you when:
- 30-day rolling GGR falls 10 % below break-even
- Aggregate promo cost spikes above target
- Studio share of lobby impressions drops below threshold (predicts future GGR slide)
When a trigger fires, schedule a renegotiation or switch to the default rev-share clause (many contracts allow 30-day notice).
8. Negotiation Tips to Improve Your Break-Even Line
- Push for a tiered fee: lower flat cost in the first three months while you ramp volume.
- Ask for free promo credits: compensates for early player acquisition burn.
- Cap hidden surcharges at a max euro figure to avoid runaway costs in high-growth markets.
- Bundle multiple studios via a single aggregator to gain volume leverage. (See The True Cost of a Game Aggregator for tactics.)
9. Free Break-Even Calculator Template
Grab the Google Sheets version linked below (no e-mail gate). It includes:
- Input cells for up to 10 studios
- Sensitivity toggles for RTP, promo %, and jurisdiction uplifts
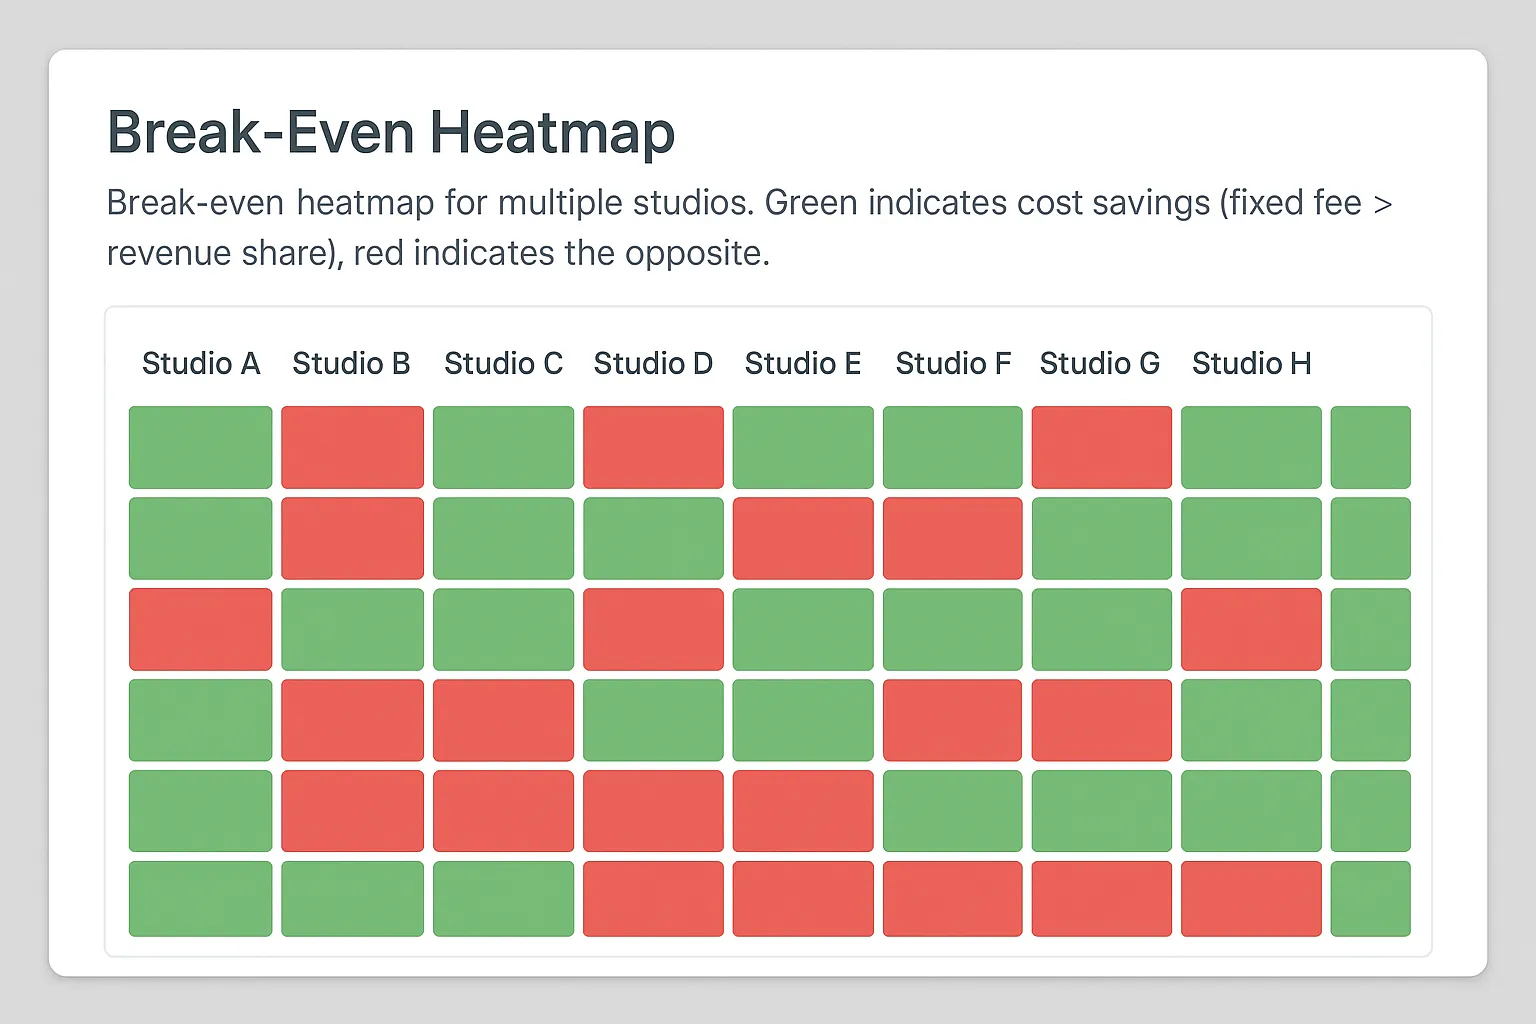
- Conditional-format heatmap and auto alerts
Spinlab customers will find a pre-filled version in the Marketplace tab of their back office.
Frequently Asked Questions
What if a studio only offers rev-share? Negotiate a declining rate once you hit predefined GGR tiers—effectively mimicking a hybrid deal.
How do I forecast GGR for a new studio with no historic data? Run a 14-day AB test in a side lobby, measure GGR per 1,000 impressions, then scale by planned lobby exposure.
Should promo costs be included in GGR or treated separately? Always subtract promo costs after calculating studio royalty; most contracts treat bonuses as operator expense.
Is payback period the same as break-even? No. Break-even here is monthly cost equivalence. Payback period applies to CapEx (e.g., buying exclusive IP) and measures cumulative ROI.
Break-Even Decisions Made Easy
Fixed-fee game deals can supercharge margin—or sink it. With the formulas, benchmarks, and live monitoring tools above, you can make data-driven calls that protect EBITDA and keep finance, product, and marketing aligned.
Ready to see your own numbers visualised in real time? Book a 20-minute Spinlab demo and we’ll plug your data into our built-in Break-Even Analyzer so you can sign (or ditch) that studio contract with full confidence.