

Online slots look simple on the surface, yet three numbers under the hood shape everything from player experience to promotion costs and risk: RTP, volatility, and hit rate. If you run product, CRM, or finance for a casino, understanding how these metrics interact will help you choose the right titles for each funnel stage, price free spins correctly, explain expectations to players and regulators, and guard your P&L from surprise variance.
What each metric means
RTP, return to player
RTP is the theoretical long‑term percentage of all wagers that a game returns to players. A 96 percent RTP means that over a very large number of spins, the game will on average return 0.96 for every 1.00 wagered. The house edge equals 1 minus RTP (so 4 percent in this example). RTP is validated during certification and is usually offered in several configurations per title, for example 88 percent, 94 percent, 96 percent. Regulators and test labs care about the theoretical model and that live outcomes do not drift outside statistical expectations over time.
For formal definitions and testing expectations, see the UK Gambling Commission’s Remote Technical Standards and guidance on theoretical return, and GLI’s public standards for gaming device math and fairness.
- UKGC, Remote gambling and software technical standards (RTS): official standards overview
- Gaming Labs International, GLI-11 and GLI-19 frameworks: gamelab standards page
Key points for operators:
- RTP is theoretical and measured over very large samples, not one session.
- Lowering or changing the RTP setting is a compliance topic, check jurisdiction rules and disclosure requirements.
- Live RTP reporting is useful for monitoring, but it will fluctuate session to session because of volatility.
Volatility, variance of outcomes
Volatility describes how widely results swing around the RTP. High‑volatility slots concentrate more of the payback into rarer, larger events (features, jackpots), which creates longer dry spells and bigger spikes. Low‑volatility slots distribute payback more evenly with frequent small wins. Vendors often label volatility on a simple scale from 1 to 5 or Low, Medium, High. There is no industry‑wide standard for these labels, so treat them as directional, not as a precise statistic.
What drives volatility:
- Symbol weighting and reel mapping
- Paytable shape and multipliers
- Feature trigger odds and feature pay distribution
- Jackpot contribution mechanics
Hit rate, chance of any win
Hit rate is the probability that a spin returns a payout of any size, usually including wins smaller than the stake. A 25 percent hit rate means roughly one in four spins shows a win animation. Some studios also publish a feature hit rate, which is the separate probability of triggering the free‑spin or bonus round. Hit rate affects perceived excitement and short‑term satisfaction, but it does not tell you the size of wins or the game’s RTP on its own.
A variant you may calculate internally is net‑positive hit rate, which counts only spins returning at least 1.00x stake. This better approximates how often a player truly advances their bankroll.
Quick comparison
| Metric | What it measures | Typical values you may see | What it does not tell you |
|---|---|---|---|
| RTP | Long‑run mean return of wagers | Commonly 88–98 percent depending on market and title configuration | Session experience, swing size, or how often wins occur |
| Volatility | Spread of outcomes around the mean | Labeled Low, Medium, High by studios, not standardized | Whether a game is “loose” or “tight,” RTP still controls long‑run payback |
| Hit rate | Probability of any win on a spin | Often 15–40 percent, varies widely by title | Win size, long‑run return, or risk of ruin |
Same RTP, different experience: how the trio interacts
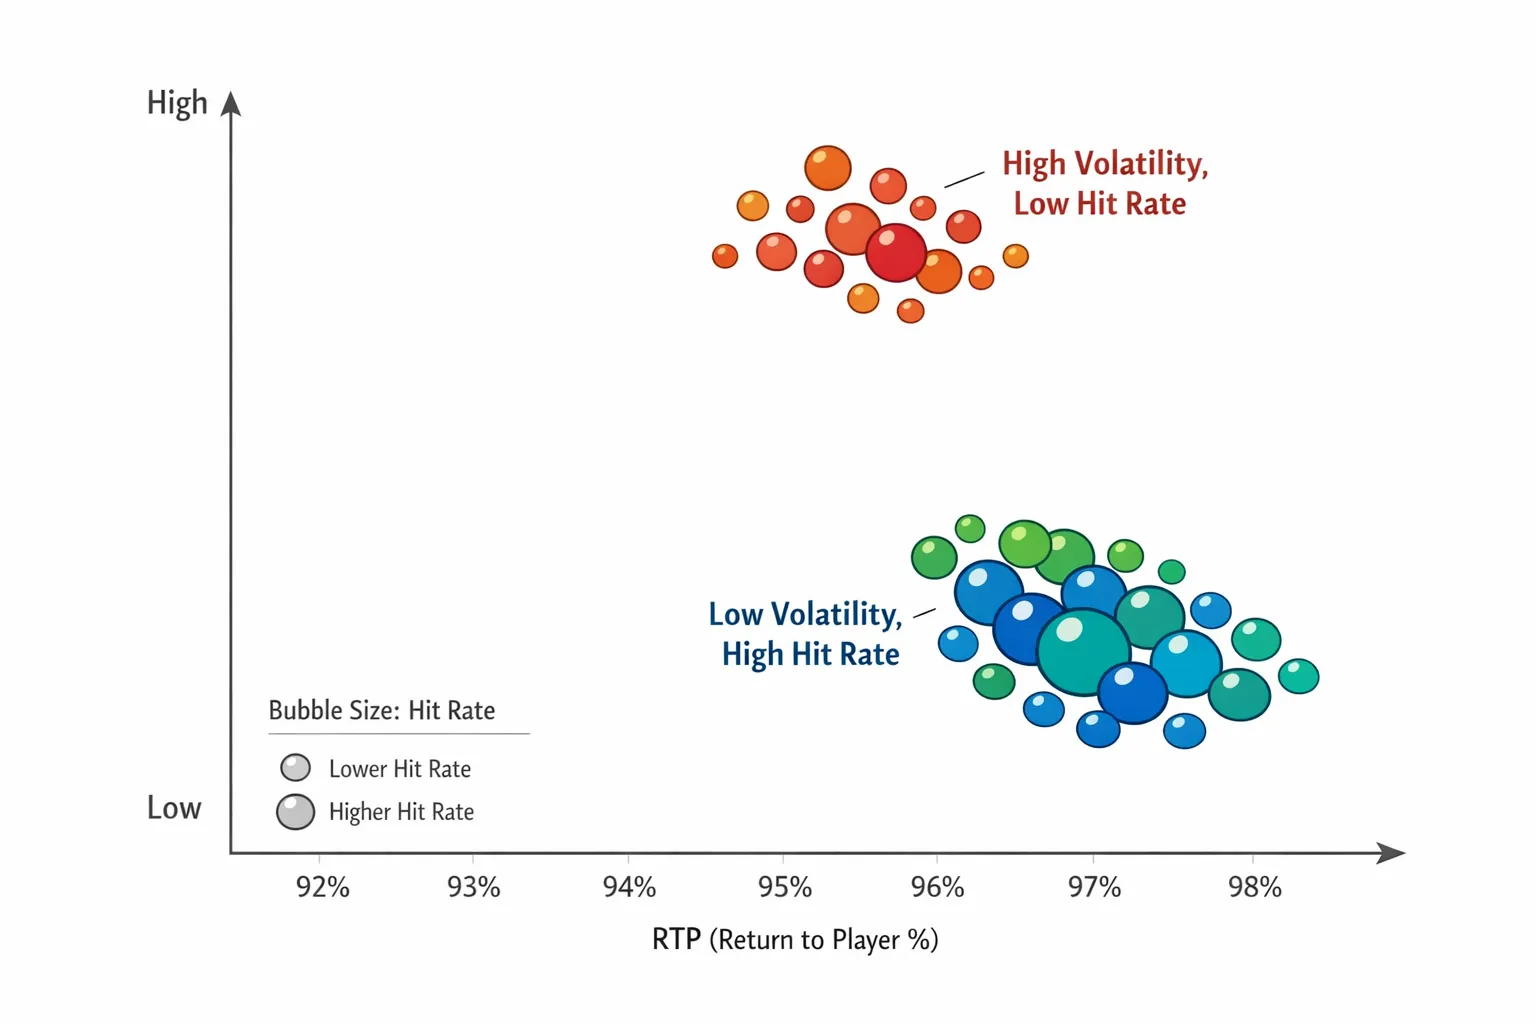
Two 96 percent RTP slots can feel nothing alike:
- Low‑volatility build, higher hit rate around 30 percent, many small line wins and modest features. Bankroll tends to decay slowly, creating long, steady sessions ideal for onboarding and free‑spin promos.
- High‑volatility build, lower hit rate around 18 percent, most of the payback locked in features or rare symbols. Bankroll will be swingy, creating moments of big excitement and many zero‑win stretches. Better for streamers, jackpots, and VIP thrill seekers.
Practical implications:
- Hit rate influences perceived fun and UI rhythm, especially for new players. It also affects how often free‑spin giveaways show visible wins.
- Volatility governs session length variance. Players on high‑volatility titles will cluster into short sessions with quick busts and fewer but longer sessions that spike on features.
- RTP controls the long‑term economics for both players and the house. Changing volatility or hit rate without moving RTP reshapes the path, not the destination.
Session math you can use
You do not need a PhD to make better decisions. A few rules of thumb go a long way.
- Expected cost of a free spin: stake × RTP. If you award 20 free spins at 0.10 with a 96 percent RTP title, the expected payout to the player is 20 × 0.10 × 0.96, which equals 1.92. That is your promo cost before any wagering requirements or clawbacks. Higher hit rate will make those spins look more exciting without changing expected cost.
- Expected long‑run player loss per session: spins × stake × (1 − RTP). For 300 spins at 0.50 on a 96 percent slot, the expected long‑run loss is 300 × 0.50 × 0.04, which equals 6. Actual sessions will vary because of volatility.
- Net‑positive hit rate matters for player sentiment. A 35 percent hit rate with mostly 0.2–0.8x wins can feel worse than a 22 percent hit rate where more hits are above stake.
To plan promos or set bankroll estimators, simulate. Monte Carlo simulation with the real paytable and reel strips produces realistic distributions of session outcomes at different bet sizes. Studios should deliver a math dossier with these artifacts. Operators can also run independent audits where regulation allows.
Using RTP, volatility, and hit rate in operations
1) Lobby curation and merchandising
- New player rows: favor medium RTP, low to medium volatility, and higher hit rate so early sessions are not barren.
- Streamer and social content: highlight high‑volatility titles with compelling features and jackpot paths. This is where new Pragmatic Play and Hacksaw Gaming releases often shine.
- Responsible gambling: add clear tooltips that explain RTP and volatility in plain language and avoid implying that any single session will reflect RTP.
2) Pricing promos and free spins
- Choose titles with enough hit rate that players see outcomes during the promo, which improves perceived value and reduces support tickets.
- Avoid pairing high bet sizes with high‑volatility titles for mass free spins. Tailor those to VIPs with clear caps and terms.
- Track promo cost per acquired depositor across titles. The same RTP can yield very different first‑session behavior because of variance.
3) VIP and bonus risk management
- High‑volatility games can create outsized wins that invalidate bonus economics if your cap and wagering rules are lax. Use segment‑specific rules and explicit session limits.
- Monitor live RTP deviations and feature streaks to identify anomalies. Short‑term deviations are normal, sustained deviations need investigation.
4) Player education and trust
Explain the trio in the cashier and game panel. Avoid making claims like “pays back 96 percent tonight.” Say “This game has a 96 percent theoretical return to player over a very large number of spins. Your results in a session will vary.” Clear, consistent language reduces complaints and aligns with regulator expectations.
If you publish live RTP, label it as recent average over a time window, and always display the certified theoretical RTP alongside it.
5) Budgeting and responsible play
Many players benefit from setting a hard entertainment budget before they play. If you publish beginner guides or RG resources, include practical budgeting tips and link to a trusted tool. A free, consumer‑grade option is MoneyPatrol’s personal finance and budgeting app, which helps people set spending goals and track discretionary budgets in one dashboard. Encouraging budgeting builds long‑term trust and reduces RG escalations.
What Spinlab adds to the picture
Spinlab’s modular iGaming platform is built to surface slot math in the places it matters and to turn data into decisions.
- Real‑time analytics: monitor spin‑by‑spin RTP deviation, session depth, and feature triggers, then feed that into bonus targeting and risk controls.
- Bonus and affiliate engine: price free‑spin campaigns correctly, enforce caps and wagering rules, and auto‑throttle offers when variance spikes.
- Game aggregation and metadata: ingest vendor math dossiers, RTP settings, and volatility labels so your lobby and CRM stay in sync without manual updates.
- Open APIs: push math metadata to your CMS, email, and push systems to personalize by volatility preference or hit rate.
- Payments, KYC and AML, multi‑currency and crypto: align bet sizing, bonus value, and withdrawal rules with player affordability and jurisdictional constraints.
If you create original titles, Spinlab can host your custom math and deliver them with the same cashier, compliance, and analytics stack.
Common myths to retire
- “Higher RTP means fewer big wins.” Not necessarily. RTP describes the average; volatility describes how payback is packaged.
- “Hit rate tells me how generous a slot is.” No, high hit rate can still mean many small below‑stake wins. Look at net‑positive hit rate and paytable shape.
- “Live RTP must equal certified RTP at all times.” Short windows will fluctuate, especially on high‑volatility games. Labs test the model; operators should monitor live data for anomalies.
- “Changing RTP is always legal if the vendor supports it.” Many jurisdictions restrict changes, mandate disclosures, and require re‑certification or specific versions. Always check.
Implementation checklist you can copy
- Collect vendor math metadata for every title, including RTP configurations, volatility label, hit rate or feature odds if available.
- Map math metadata to your lobby and CRM so you can segment by preference, for example volatility chasers versus steady‑session players.
- Price free‑spin campaigns with expected cost per spin and a buffer for variance. Log the effective cost per FTD by title.
- Monitor live RTP over rolling windows. Create alerts for sustained deviations, large feature droughts, or payout clusters.
- Educate players in product copy with plain‑English definitions and avoid implying that RTP applies to a single session.
Frequently asked questions
Is a 98 percent RTP always better for my casino funnel? Higher RTP can improve player satisfaction and retention, but it shrinks house edge. Use higher RTP strategically for acquisition and early retention, then let segments find the volatility mix they enjoy.
Does hit rate include below‑stake wins? Usually yes. Many vendors count any nonzero payout as a hit. Internally, track net‑positive hit rate to understand how often players advance their bankroll.
Can two games with the same RTP have different bonus costs? Yes. The expected cost of a single free spin is stake × RTP, but the player experience and conversion lift depend on hit rate and volatility. That affects real promo ROI.
How long does it take for RTP to “show up” in data? A very long time, often millions of spins. Short‑term reports will bounce around, especially for high‑volatility titles.
Is volatility standardized across studios? No. Volatility labels are directional. Ask for math dossiers or run your own simulations to compare titles properly.
Can operators change RTP settings? Sometimes. Many titles ship with multiple certified RTP settings. Whether you can switch between them, and how you must disclose that, depends on jurisdiction and your certification scope.
Is live RTP the same as theoretical RTP? Live RTP is an observed average over recent play. Theoretical RTP is derived from the game math and validated in certification. Both are useful, but they serve different purposes.
Turn slot math into revenue, not guesswork
If you want a lobby that sells itself, promos that price correctly, and analytics that flag risk before it becomes a loss, book a walkthrough of Spinlab’s all‑in‑one, crypto‑ready iGaming platform. We will show you how to surface RTP, volatility, and hit rate where they matter, and how to launch and scale faster with a modular stack and a Shopify‑like admin experience.