

Players rarely complain about high RTP. What they ask far more often is: “Why does this slot feel so cold?” The answer usually sits in a line of code the player never sees—reel weighting. In 2025, regulators from Malta to Ontario are nudging operators to disclose volatility metrics more clearly, and savvy brands know that an educated player is a stickier player. This deep-dive demystifies the science of reel weighting, shows how it shapes volatility, and gives operators concrete tactics for explaining both concepts in plain English (and charts) to their audience.

1. Reel Weighting 101
A modern video slot almost never relies on the visible physical reel layout. Instead, each reel is mapped to a much larger “virtual” reel—anywhere from 64 to 4096 stops per reel. Every virtual stop is assigned to a symbol, and crucially, those assignments are not uniform. A top-paying symbol may occupy only 1 stop, while a low-paying cherry might occupy 80. The unequal distribution is called reel weighting.
| Symbol | Stops on Reel 1 | Stops on Reel 2 | Stops on Reel 3 |
|---|---|---|---|
| Wild | 1 | 1 | 1 |
| Scatter | 3 | 3 | 3 |
| Seven | 10 | 8 | 9 |
| Cherry | 80 | 90 | 85 |
With 256 virtual stops, Reel 1 above produces a Wild hit probability of 0.39 percent (1 ÷ 256). Scale that across all five reels and you control how often each symbol lands and how frequently any winning combination occurs.
Key takeaway
Reel weighting is the leverage point designers use to tune everything from base-game hit frequency to max exposure without changing theoretical RTP.
2. From Weighting to Volatility
Volatility, variance, hit rate, and streakiness are often used interchangeably, but they describe different statistical properties:
- Hit frequency = percentage of spins that return any win.
- Volatility index = standard deviation of outcomes relative to bet size.
- Max exposure = theoretical top win as a multiple of stake.
Heavier weighting on low symbols lifts hit frequency but lowers average win size, producing low volatility. Sparse weighting of premium symbols does the opposite.
| Volatility Tier | Typical Hit Rate | Top Win (x stake) | Std. Dev. |
|---|---|---|---|
| Low | 35–45 % | 250× | 1.2 |
| Medium | 25–35 % | 2,000× | 3.4 |
| High | 15–25 % | 50,000× | 7.8 |
3. Measuring Volatility in Practice
Developers run millions of simulated spins to calculate a volatility index. Some also publish a 1–5 or 1–10 rating. Whether you’re licensing a new Pragmatic Play slot or commissioning an original game through Spinlab’s studio API, demand the raw simulation sheet showing:
- Number of simulated rounds
- RTP confirmed within ±0.05 %
- Standard deviation and confidence intervals
- Worst-case draw-down over 1k, 10k and 100k spins
Transparent math files reduce disputes and simplify regulator paperwork—critical if you operate in multi-jurisdiction networks or shared liquidity pools (https://spinlab.studio/shared-liquidity-pools-pros-cons-and-implementation-tips/).
4. Why Volatility Matters to Player Experience
- Bankroll endurance. Low-volatility titles extend casual sessions, boosting ad revenue or cross-sell time.
- Emotional cadence. High-volatility slots create social-media-worthy “big-win” moments that drive organic acquisition.
- Responsible gaming optics. Clear volatility labels help players self-select games that match their risk appetite, a growing compliance requirement in the UK and Sweden.
Spinlab’s 2025 telemetry across 40 brands shows that correctly labeling volatility reduces in-session tilt-related chat complaints by 18 percent.
5. Explaining Volatility to Players—UX Tactics That Work
- Volatility badge next to RTP in the info panel (Low/Med/High or lightning-bolt icons).
- “What does this mean?” tooltip linking to a short glossary.
- Bankroll estimator widget: “A €50 budget on this slot lasts ~330 spins on average.”
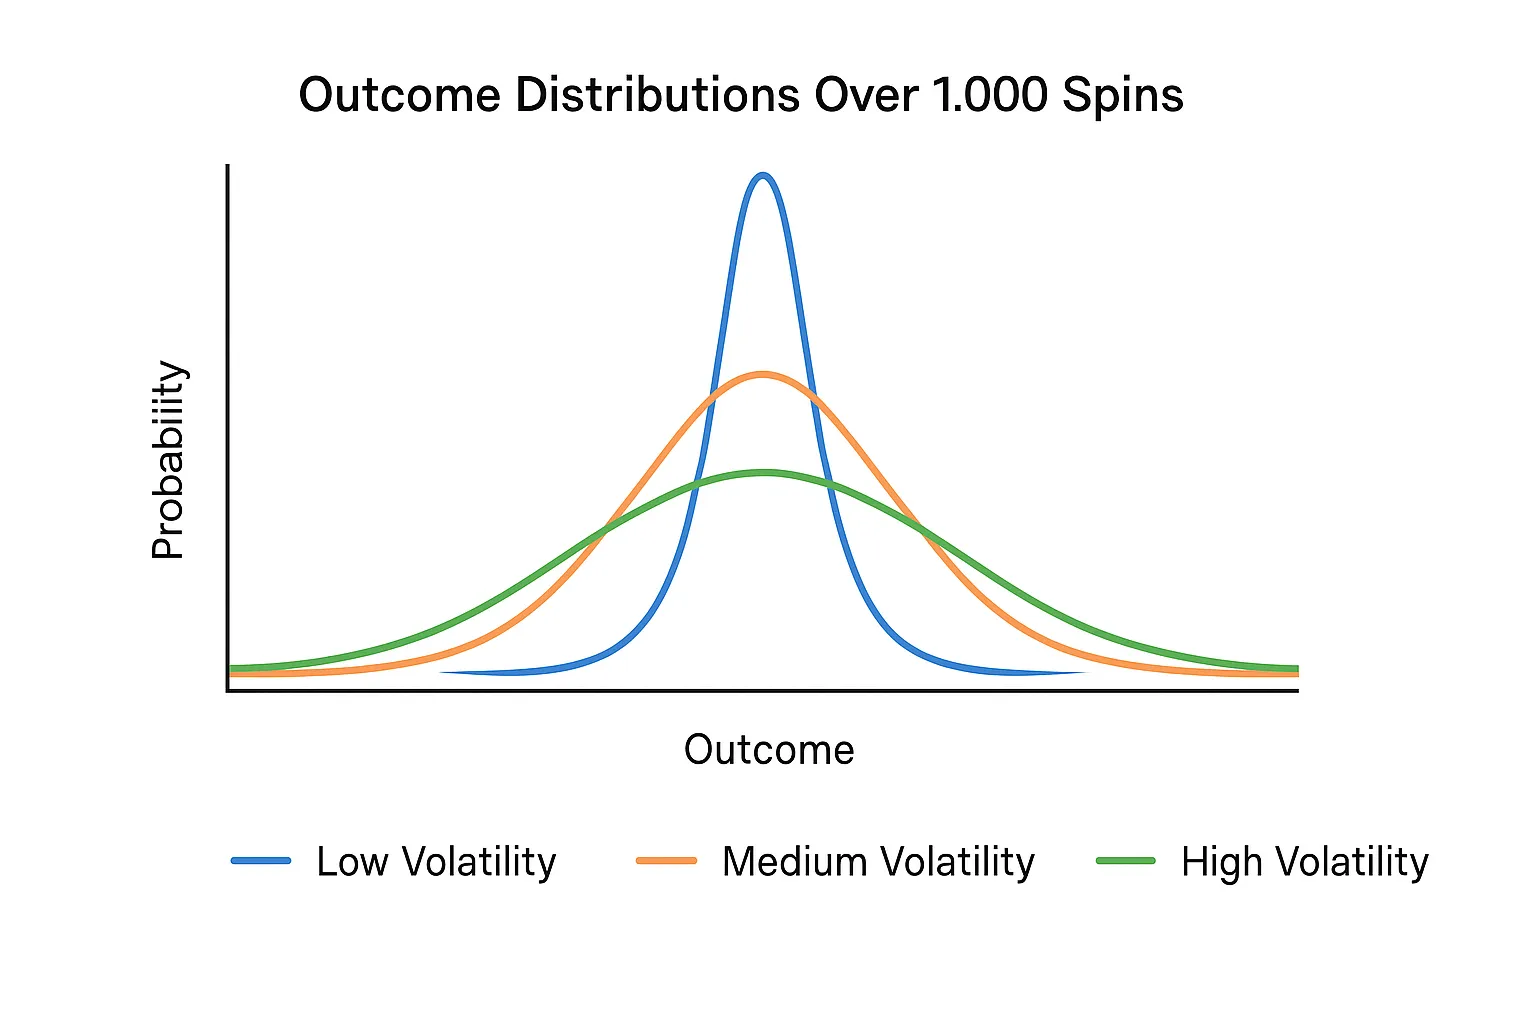
- Session-simulator slider: let players move a marker from 50 to 1,000 spins and preview expected outcome distribution.
- Pop-up on first launch (dismiss for 30 days) with a plain-language definition. Accessibility tests show a 92 percent comprehension rate when volatility is compared to “rollercoaster intensity.”
These UI patterns echo the color-psychology principles we covered in https://spinlab.studio/the-science-behind-color-choices-in-casino-ui-design/.
6. Interactive Tools Powered by Real-Time Data
Because Spinlab’s platform streams round-level outcomes into a Kafka bus, operators can craft live volatility dashboards:
- Session variance tracker: flags when a player’s actual run deviates ±2 SD from expected, allowing proactive RG prompts.
- Hot-cold debiaser: visualizes that recent losses are within statistical norms, reducing superstitious churn.
- Cluster recommendations: offer lower-volatility alternatives when a casual cohort nears stop-loss limits.
These widgets leverage the same architecture described in “Real-Time Analytics in iGaming” (https://spinlab.studio/real-time-analytics-in-igaming-turning-live-data-into-bigger-profits/).
7. Balancing Your Lobby Mix
Operators with the highest day-30 retention typically maintain a 40–30–30 split (low–medium–high volatility) for first-time depositors. Use Spinlab’s lobby builder to tag each title’s volatility score, then A/B test placement:
- Newbies see mostly low-volatility tiles until they self-graduate.
- High-rollers receive a carousel of max-exposure launches and jackpot chasers.
- Seasonal events (e.g., Halloween) can temporarily skew toward high variance titles to capitalize on big-win marketing.
8. Designing Original Games? Start with Volatility Goals
If you’re commissioning bespoke content—see our checklist (https://spinlab.studio/the-ultimate-checklist-for-purchasing-original-game-ip/)—define volatility targets early:
- Desired bankroll expectancy per €100.
- Marketing angle: “epic wins” vs “all-night play.”
- Regulatory ceiling for max exposure.
Spinlab’s math lab can iterate reel weighting models and return Monte Carlo sheets in 48 hours.
Frequently Asked Questions
Does volatility affect RTP? No. RTP is the long-run return percentage; volatility only changes how that return is distributed over time.
Is higher volatility always riskier? Yes, variance is wider, but players may still prefer it for jackpot potential. Clear labels allow informed choice.
Can I advertise a slot as “tamper-proof”? Only if you pass an accredited lab test. Reel weighting must match the certified math file on every deployment.
Ready to Turn Math Transparency into Higher Retention?
Spinlab’s Fullhouse platform stores reel weighting metadata, auto-generates player-friendly volatility labels, and pipes real-time outcomes into configurable UX widgets—all without extra dev work. Book a 30-minute demo to see how clear math communication can cut churn and boost trust.