

Casino cohort analysis shows whether players who registered in the same month remain active as their accounts age. Unlike a headline monthly active player count, it separates acquisition growth from retention, helping an online casino see whether new signups are becoming a durable player base or simply replacing people who leave.
The useful version starts with a fixed signup population, a precise definition of activity and equally mature observation periods. This guide explains how to build that report, interpret its patterns and connect the findings to onboarding, payments and sustainable commercial performance.
What Casino Cohort Analysis Actually Measures
A signup cohort is a group of players whose accounts were created during the same calendar month. Every player stays assigned to that original cohort, regardless of when they first deposit or return.
The report follows each cohort through successive periods:
- Month 0: The calendar month in which the player registered.
- Month 1: The next calendar month after registration.
- Month 2 and beyond: Subsequent calendar months, measured using the same activity definition.
The core calculation is:
Month k retention = distinct cohort members active in Month k ÷ original signup cohort size × 100
Suppose 1,000 players registered in June and 220 of them were active in July. June's Month 1 retention is 22%.
The denominator stays at 1,000. Do not divide by June's active players, July's depositors or the players still eligible for marketing. Those denominators answer different questions.
Strictly, this is signup-cohort activity retention. Someone who registers in June but first plays in July counts in Month 1, even though they are activating rather than returning. Track first activation separately if you need to distinguish those behaviors.
Define Activity Before Building the Report
Choose one primary retention event
A login, deposit and wager represent different behaviors. Combining them into one undefined “active player” metric makes comparisons difficult.
For a gameplay-focused report, a practical definition is at least one valid, settled wager with a positive cash-funded stake during the observation month. Exclude demo play, bonus-only wagers and voided transactions. Document how mixed cash-and-bonus wagers qualify.
Use the authoritative settlement timestamp consistently if settlement defines activity. Do not switch between bet placement and settlement dates across game providers.
Other measures can sit alongside the primary metric:
| Measure | Qualifying behavior | What it helps diagnose |
|---|---|---|
| Session retention | An authenticated session | Whether players return to the site |
| Depositor retention | A successful deposit | Continued funding behavior |
| Cash-wager retention | A qualifying cash-funded wager | Continued gameplay participation |
| Bonus-only activity | Gameplay funded entirely by promotional credit | Promotional participation rather than cash-funded activity |
A payment failure can leave session retention unchanged while deposit and gameplay retention weaken. Separate measures make that distinction visible.
Keep Month 0 honest
When the denominator is all signups and activity requires a wager, Month 0 is not automatically 100%. It measures same-month activation.
A Month 0 value of 40% means 40% of registrants completed the qualifying activity before their signup month ended. Setting it to 100% would hide the registration-to-play gap.
Registration cohorts and first-time depositor cohorts should therefore be separate reports. The former includes acquisition and onboarding performance. The latter examines behavior after an initial funding milestone.
Neither is inherently better, but switching between them can make retention appear to improve without any underlying behavioral change.
Build a Reliable Cohort Dataset
The report needs a stable player identity, a registration timestamp and authoritative activity records. A minimal reporting model should also preserve acquisition attributes as they were known at signup.
| Field | Purpose |
|---|---|
| Canonical player ID | Counts each player once under a documented identity policy |
| Registration timestamp | Assigns the signup cohort |
| Activity ID and timestamp | Identifies qualifying activity and its observation month |
| Activity status and funding type | Excludes voided or nonqualifying activity |
| Signup acquisition source | Supports channel comparisons without later attribution changes |
| Signup market and device | Supports consistent contextual segmentation |
| Test-account flag | Removes internal testing under a fixed exclusion rule |
Convert timestamps into one reporting timezone before assigning months. UTC is a practical choice, but consistency matters more than the choice itself.
Deduplicate activity at the player-month level. A player with 500 qualifying wagers should contribute one retained player, not 500 observations.
Spinlab's guide to casino event tracking and identity resolution covers the underlying data foundation. Cohort reporting depends on those definitions remaining consistent across payment, gaming and account systems.
Preserve valid historical signups when an account later closes or becomes restricted. Removing them retrospectively can inflate retention. Maintain a separate contact-eligibility population for operational use, rather than silently rewriting the original cohort.
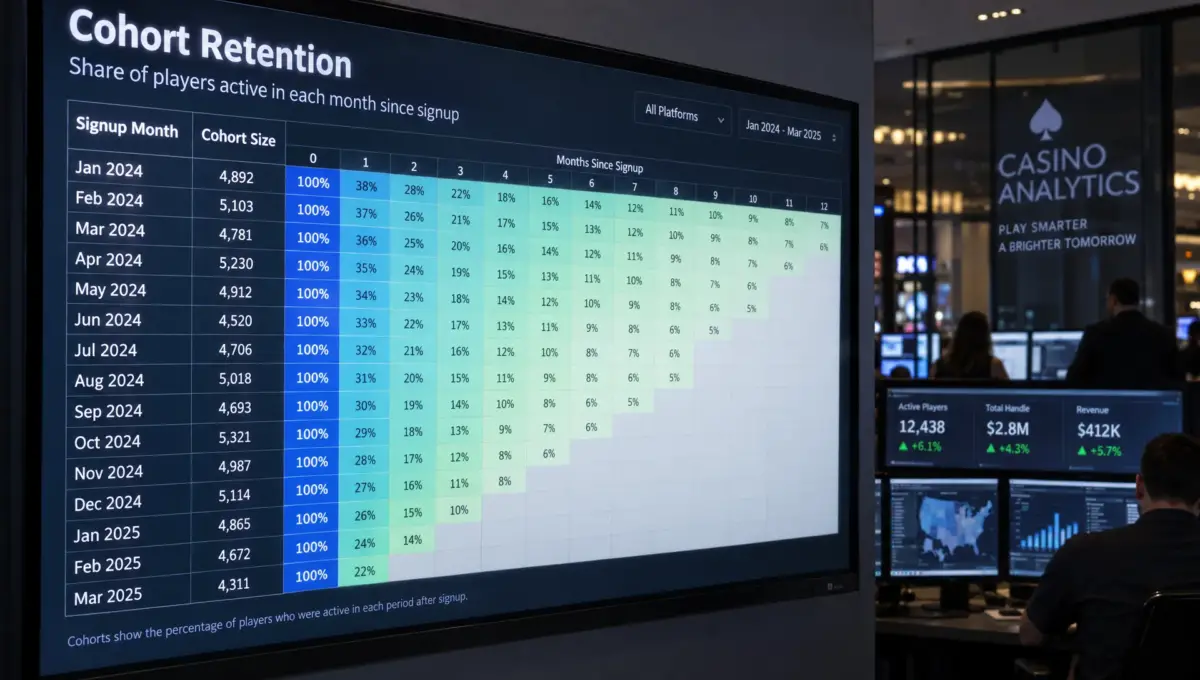
Build and Read a Signup-Month Retention Table
The following numbers are illustrative, not Spinlab customer results or industry benchmarks. The reporting cutoff is October 1, 2026 at 00:00 UTC, making September the last complete calendar month.
| Signup cohort | Signups | Month 0 | Month 1 | Month 2 | Month 3 |
|---|---|---|---|---|---|
| June 2026 | 1,000 | 40% | 22% | 16% | 12% |
| July 2026 | 1,200 | 42% | 25% | 18% | Not yet observed |
| August 2026 | 900 | 39% | 21% | Not yet observed | Not yet observed |
| September 2026 | 1,100 | 41% | Not yet observed | Not yet observed | Not yet observed |
June's Month 1 value represents 220 active players in July. July's Month 1 value represents 300 active players in August.
Compare down a column to assess cohorts at the same age. July's Month 1 retention is three percentage points higher than June's, but that difference alone does not establish that a product change worked.
Read across a row to follow one cohort over time. June declines from 40% same-month activation to 12% activity in Month 3. That pattern describes participation at each age, not a requirement that the same players were active every month.
Leave immature cells blank
An unobserved period is not zero retention. July's Month 3 falls in October, which is incomplete at this reporting cutoff.
If you publish partial periods, label them explicitly and keep them out of completed-period comparisons. Otherwise, newer cohorts can look artificially weak simply because they have had less time to generate activity.
Calendar-month cohorts also give Month 0 unequal exposure. A June 1 signup has much more time to activate in June than a June 30 signup.
For tighter onboarding analysis, supplement the report with fixed elapsed-time windows, such as activity during days 30 through 59 after signup. Do not label calendar Month 1 as “day-30 retention”; they measure different things.
Weight pooled retention by cohort size
When combining cohorts, divide total retained players by total eligible signups. Do not simply average the displayed percentages.
In the example, the completed Month 1 observations contain 220, 300 and 189 active players from cohorts totaling 3,100 signups:
Pooled Month 1 retention = (220 + 300 + 189) ÷ (1,000 + 1,200 + 900) = 22.9%
Only include cohorts with a fully observed Month 1. This keeps incomplete cohorts out of the numerator and denominator together.
Diagnose Patterns Without Mistaking Correlation for Cause
Separate activation problems from later retention problems
Weak Month 0 activation points toward the journey between registration and first qualifying play. Inspect verification completion, successful funding and time to first wager before assuming the casino needs larger incentives.
Strong Month 0 followed by weak Month 1 suggests a different investigation: whether the initial experience creates reasons to return, whether a payment problem appears later or whether the acquisition campaign attracts mainly short-lived promotional participation.
These patterns narrow the investigation; they do not identify a cause by themselves. A high Month 0 rate can also reflect signup timing, acquisition mix or delayed settlement behavior.
Always inspect the counts behind the percentages. A small cohort can move sharply after only a handful of players return or fail to return.
Control for acquisition mix and calendar effects
An overall improvement can occur because more signups came from a historically stronger channel, even if retention within every channel stayed unchanged.
Start with a few meaningful signup-time dimensions: acquisition source, market and device. Compare like-for-like groups before attributing a change to an onboarding release or payment gateway integration.
Avoid creating dozens of tiny segments. Report sample sizes and uncertainty, particularly when differences are small. For formal comparisons, a confidence interval for the difference in proportions is more informative than a colored cell alone.
Account age and calendar time also overlap. June's Month 1 happens in July, while July's Month 1 happens in August. Holidays, product outages or campaign schedules can affect those periods differently.
A cohort report identifies a signal worth investigating. A properly randomized experiment provides stronger evidence that a particular change caused the improvement.
Avoid hindsight in segmentation
Use acquisition attributes captured at signup rather than a player's latest CRM label. A later VIP classification already reflects subsequent behavior and can make comparisons circular.
Payment-method segmentation needs similar care. Players who eventually deposit with crypto have passed a milestone that nondepositors have not. Comparing that group directly with all fiat-oriented signups creates selection bias.
Use clearly defined depositor subcohorts for payment-rail comparisons, while retaining the all-signup report as the acquisition baseline.
Connect Retention to Value and Responsible Operation
Pair participation with economics
Retention alone does not establish profitability. A cohort can remain active while generating substantial promotional costs, payment costs or fraud losses.
Alongside the retention table, report cumulative net gaming revenue per original signup and a clearly defined contribution measure. State exactly which costs are included so finance and CRM teams use the same interpretation.
For example, distinguish net gaming revenue from contribution after game-provider fees, payment processing costs and other directly attributable costs. Avoid subtracting bonus costs twice if your revenue definition already deducts them.
Use the same observation horizon when comparing value. A six-month-old cohort has had more time to generate revenue than a two-month-old cohort. Likewise, revenue attributed to a signup cohort should remain attached to those original players rather than being reassigned to whichever campaign contacted them most recently.
Keep safety controls outside retention optimization
Reduced gambling activity is not automatically a problem to reverse. It may reflect a player's choice to spend less time gambling or use account controls.
Self-excluded players, accounts under applicable restrictions and players showing potential harm must not become reactivation targets. Marketing consent and contact eligibility should be checked separately from historical cohort membership.
Do not relax KYC, AML or responsible-gambling controls to improve a retention curve. Use the analysis to identify avoidable service friction, not to pressure individuals into more frequent play or higher spending.
Aggregate reporting and restricted access to player-level data help teams investigate performance without distributing unnecessary personal information.
Establish a Repeatable Monthly Review
A useful monthly review produces a short decision record, not just a refreshed heatmap.
- Confirm data completeness: Reconcile registrations and activity, check provider coverage and record the extraction cutoff.
- Publish mature comparisons: Show cohort sizes, completed-period retention and any historical restatements.
- Identify the largest credible change: Check its absolute player count, segment mix and uncertainty.
- Investigate the relevant journey: Examine verification, payment or gameplay events associated with the change.
- Assign a test and an owner: Define the intended improvement, safety guardrails and evaluation window before implementation.
Keep a change log for tracking definitions and product releases. If a game aggregator begins sending previously missing activity, the resulting retention increase is a measurement correction, not necessarily better player behavior.
Allow for late-arriving events and document how reversals or corrected settlements affect historical figures. Either restate affected periods consistently or maintain clearly versioned snapshots.
Once a cohort pattern identifies a specific service problem, real-time retention analysis can help investigate it closer to when it occurs. The monthly report establishes the pattern; event-level monitoring helps locate the friction.
Frequently Asked Questions
What is a good monthly casino retention rate? There is no universal benchmark that is meaningful without matching the denominator, activity event, market and observation window. Start with your own mature cohorts and compare like-for-like segments. A signup-based cash-wager rate is not directly comparable with depositor-based login retention.
Should signup cohorts include players who never deposit? Yes, if the report measures retention from registration. Excluding nondepositors changes the question and hides part of the acquisition-to-activation journey. Publish a separate first-time depositor cohort report when you want to study post-deposit behavior.
Can retention increase in a later month? Yes. Players may return after an inactive month, while some registrants activate for the first time later. Period-based activity retention does not require continuous participation. A continuous-retention or survival measure uses different rules.
How often should the cohort table update? The underlying data can refresh daily, but completed calendar-month comparisons should use closed observation periods. Label current-month values as provisional and apply a documented policy for late events and corrections.
Put Consistent Measurement Behind Your Platform Decisions
Accurate cohort reporting depends on stable identities, clear event definitions and access to reliable operational data. A dashboard alone cannot resolve inconsistent inputs.
Spinlab's modular iGaming platform includes real-time analytics, a customizable backoffice and open API integration. When evaluating your reporting setup, confirm how signup, payment and gameplay data can support the cohort definitions above, including historical access and reconciliation requirements.
